During some recent marketing and educational activity with our client base of over 1,500 SMBs, we wanted to take a closer look at the true growth of Mobile Device traffic to our clients’ websites during the past few years.
Our chart below shows the aggregated Google Analytics data of 1,000 of our UK-based small to medium size business clients which range from solicitors to restaurants and architects. By collating and averaging the ‘Mobile Usage Overview’ data, we were plot the following chart:
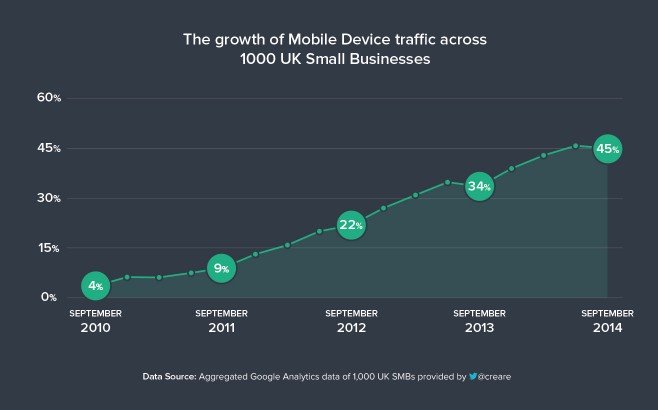
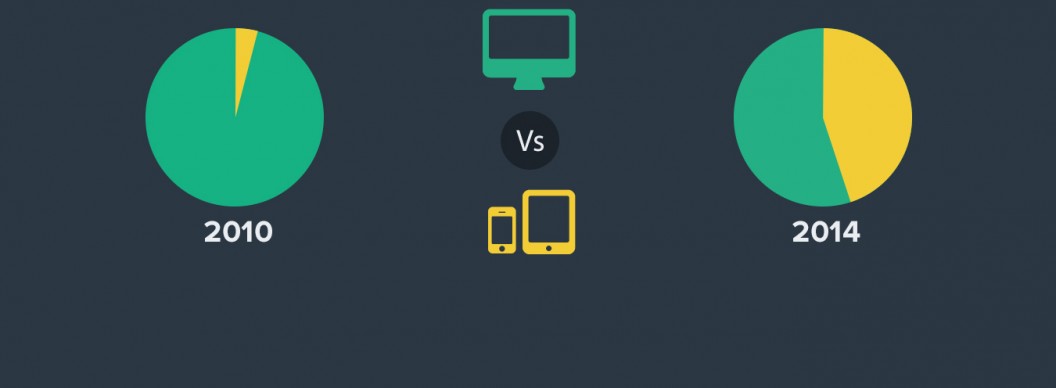
As you can see from our simple graph, Mobile Device traffic (which includes both Smartphones and Tablets) has grown exponentially over the past four years in line with the well-known Morgan Stanley Prediction made in 2010.
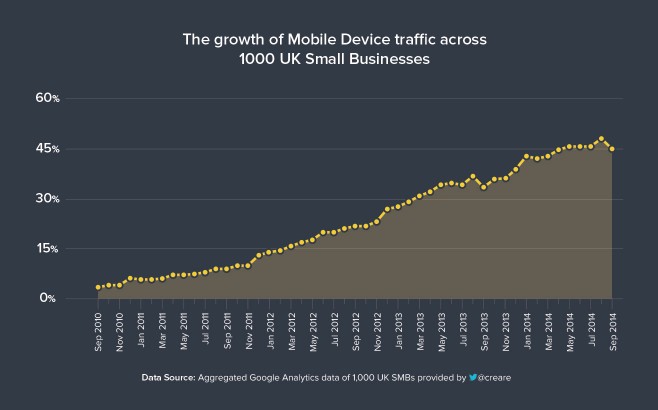
As part of our internal Client Reporting System, we’re able to access all of our clients’ data through the Google Analytics APIÂ and view the average Mobile vs Desktop percentages over the past four years. Here’s a second chart which breaks the data down further by month:
Accessing and using this data
If you would like to access the data behind this chart and research, we’ve made the content available in the following ways:
If you would like to use our data or charts within a blog, article or deck etc, we kindly ask for a source credit in return please.