
Henry Ford has traditionally been quoted as saying “I know half of my advertising budget is wasted – I just don’t know which halfâ€, and particularly in the SME market, where budgets are more limited, it’s essential to know where you’re getting the most ‘bang for your buck’ with your advertising and marketing strategy.
The massive advantage for small businesses who invest in digital as a primary advertising channel is the transparency this provides when measuring results and ROI. This post looks specifically at some of the ways to ensure that you’re getting the most out of Google Analytics when it comes to measuring the success of digital marketing campaigns – including ensuring that more in depth tracking is set up to improve visibility over conversions, as well as setting up customised dashboards that give you the most relevant performance information quickly.
It seems clear that all businesses are quickly getting smarter about digital – and small businesses in particular are starting to ask more questions about where their money is being invested and what this is achieving for them. It’s not just a case of making sure that the one channel that they invest in is working correctly either – increasingly small businesses are investing in multiple digital channels, including email marketing and social media as well as organic and paid search as part of far more sophisticated campaigns. This post looks at the key features and reports that can help you to better use Google Analytics both to get clearer insights into overall website performance and understand return from multi channel marketing efforts.
GA has an absolute raft of different features, but I’ve just picked my top 5 focus areas that I feel can help ensure that you’re getting as much visibility as possible over your campaigns in Analytics. It’s worth bearing in mind that it would easily be possible to write a full post on each one of these areas providing a full breakdown – but I’ve just put together a quick overview on each point with some tips on how to use.
- Fully integrated Google Analytics
- Goals and Conversion Tracking
- Custom Dashboards
- Custom Segments
- Multi-Channel Funnels
1) Ensure your Analytics Account is Fully Integrated
The most important initial check to make is whether all of your campaigns are being tagged correctly and therefore coming through to the Analytics dashboard as an accurate reflection of your website traffic sources. Â This means you can ensure your display ads, email campaigns and any other campaigns are being reported correctly as traffic sources in GA.
By using the Google URL Builder you will be able to quickly and easily tag your URLs with information that Google Analytics will be able to use.
https://support.google.com/analytics/answer/1033867
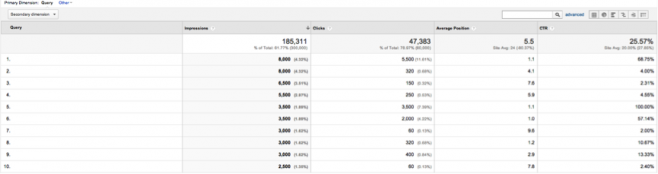
It’s also really key to make sure your Analytics account is as well integrated as possible with other services and platforms run by Google so you have as much information as possible in the one place. A couple of handy essentials are to ensure that your Webmaster Tools and Analytics accounts are linked so you can get useful information on impressions for different keywords and landing pages – accessible in the ‘Search Engine Optimization’ tab.
In addition to this, your adwords account should also be linked with Analytics so you can review your adwords campaign in conjunction with your other website traffic.
2) Set up Customised Goals & Conversion Tracking
Step one is to make sure that you’ve set up some initial tracking around the ‘conversion points’ on your website to ensure that you’re measuring how customers are interacting and reaching these goals.
Some of the top ones that we tend to use include:
Goals
Most commonly, we’ll ensure that goals are set up to track the number of sessions that result in a visit to the website’s contact page, as well as visits to the successful contact / thank you for your enquiry page as well.
These are really easy to set up in the Analytics admin dashboard, with a quick screen shot below of how I’ve set one up recently:
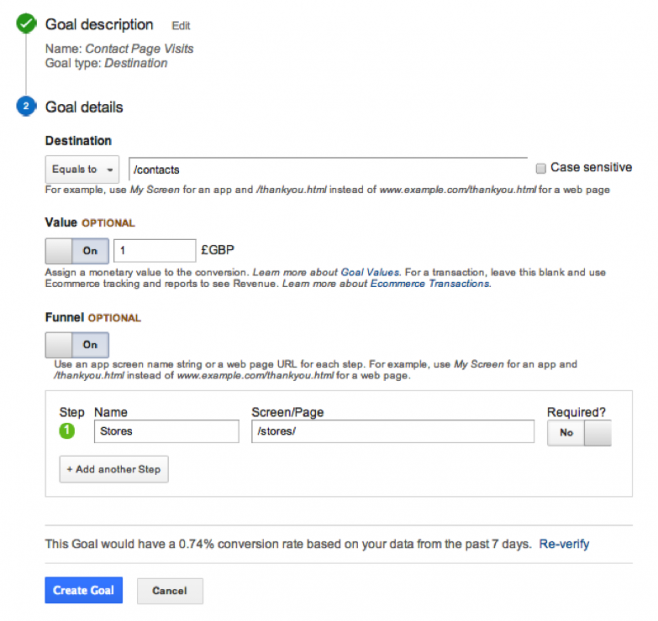
You could set up goals to track visitors to any particular destination page on your website, as well as using goals to do things like measure sessions that have lasted a certain length of time or have included a certain number of page views.
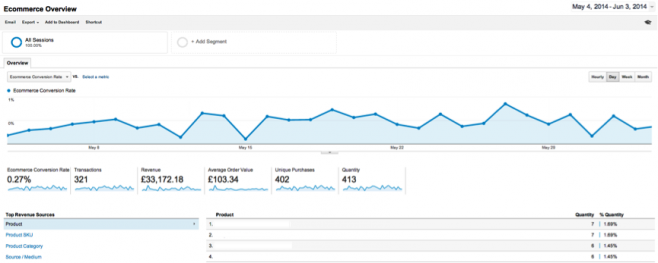
E Commerce Tracking
E Commerce tracking is really key for any customers who are running online shops – and is straightforward to integrate on most e commerce platforms. It provides a real wealth of information on people purchasing through the website, and the path they’ve taken to convert, products sold etc. You can check in the general settings in admin whether this tracking is in place, and the E Commerce tab is under ‘Conversions’ to view your data.
Events
Finally, setting up events is a great way to track specific actions that take place on your website – and can commonly be used to track things like click to call actions from mobile users, video plays and social shares.
We’ve written a couple of posts ourselves on how to set this up for standard analytics and also universal.
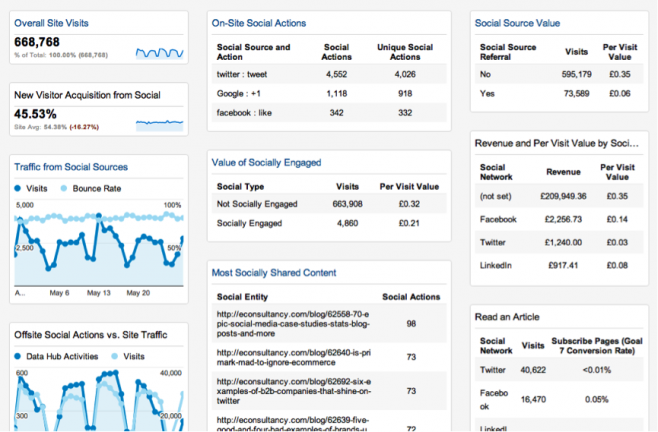
3) Set up Custom Dashboards to get Important Data in One Place
I also find it really helpful to use the ‘Dashboards’ feature to create Custom Dashboards that include the key stats from Analytics
in one place. These are really simple to create – and you can include up to 12 ‘widgets’ on each dashboard – as well as sharing dashboards you create so they can be easily set up across multiple accounts, for example if you’re working agency side and want some consistency across your reporting.
There’s also a gallery of dashboards available in Google Analytics that you can easily install rather than creating your own from scratch.
The links below are to a couple of dashboards I’ve built that I find particularly useful – primarily on e commerce websites:
E Commerce & Conversions Overview
https://www.google.com/analytics/web/template?uid=-y9mmqmYSgK_Vy0hl8NBSA
Website Engagement Stats
https://www.google.com/analytics/web/template?uid=4QS3flhuSSiKK628djvppQ
There’s also a couple mentioned in a historic E Consultancy Blog (https://econsultancy.com/blog/62828-10-useful-google-analytics-custom-dashboards#i.12hgax1gdxfaju) that I think are great if you’re running integrated digital campaigns and want easy overviews of areas like PPC and social as well as your standard Analytics data.
PPC Dashboard:
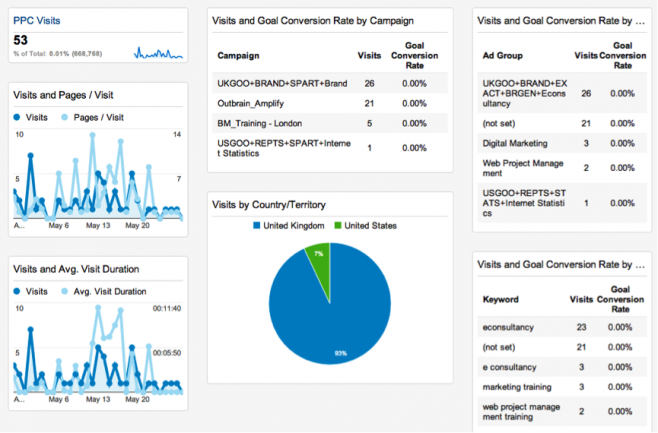
Social Dashboard:
4) Custom Segments
Custom segments also allow you to create great customised views of your data – and I’d definitely recommend getting to grips with these and using them wherever possible to filter down further and find out more about user behaviour on your website.
Custom segments have been around for a while, but they’ve evolved to become more and more user friendly – and a whole range of pre-set selections can be found as below:
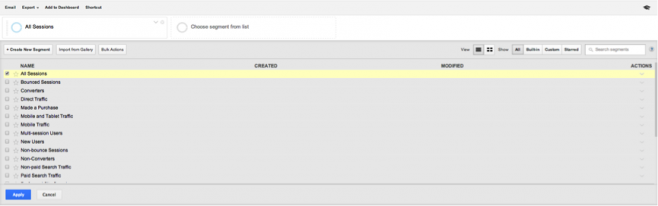
Up to 4 of these can be selected together and used in conjunction to provide comparative data from your Analytics:
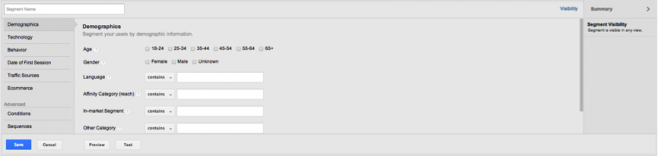
Finally, it’s possible again to select further pre set custom segments from the gallery – or you can create your own based on the 5 types of segments:
- Demographics
- Technology
- Behaviour
- Date of First Visit
- Traffic Sources
5) Multi Channel Funnels
The last section of Analytics I wanted to review was the multi channel funnels section – another area that possibly isn’t used by a lot of people but which can provide some great additional insights to the usual reports that tend to get used.
The majority of data in Google Analytics works on the basis of conversions being measured by the ‘last click’ interaction that led to that conversion. For example, if someone found your website initially from a PPC ad, visited again after being reminded by a remarketing ad on the display network, before finally purchasing after making a product specific organic search – that conversion would be wholly attributed to the organic visit, ignoring the path that’s led up to this point.
However, in Multi Channel funnels you can step back and see a 30 day record of the paths leading to conversions – a really useful overview of this can be found in the ‘Top Conversion Paths’ report:
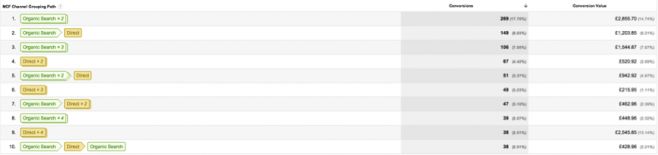
Once all of your different campaigns are tagged and included in this report, it can really help to define which areas of your marketing are working well to attract visitors that lead to conversions as well as the marketing activity which is leading directly to conversions.
Another really useful report in this area that can help to understand the ‘knock on’ effect of different marketing investments is the ‘Assisted Conversions’ report – that can help to attribute the value of conversions that have been assisted by other channels that have not necessarily been assigned as responsible as part of the last click model.
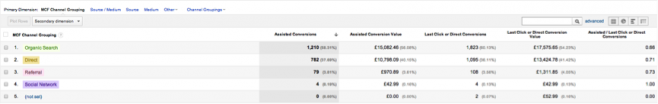
This example shows that organic search has been responsible for assisting 1,210 additional conversions that would not normally have been attributed to this channel. Quick word of warning with this report that the assisted conversion figures for the different channels you have set up aren’t mutually exclusive and therefore can be ‘claimed’ by multiple channels in their row in the table.
Other Points…
Finally, I wanted to give a shout out to some of the really useful Analytics blogs / experts out there – if Analytics is something you want to know more about to support your digital marketing, these resources are fantastic:
- Koozai Blog – Analytics Category
- Fresh Egg Blog – Analytics & Conversion Category
- Justin Cutroni’s Blog – Analytics Evangelist at Google
- Avinash Kaushik’s Blog – Digital Marketing Evangelist at Google
- Google Analytics Blog
Google are also periodically releasing online training courses that look at specific areas of Google Analytics – most recently the ‘E Commerce Analytics: From Data to Decisions’ module which is open for registration now, on this link: https://analyticsacademy.withgoogle.com/explorer.
The other two modules available on that link ‘Digital Analytics Fundamentals’ and ‘Google Analytics Platform Principles’ are still available for self study, although sadly, you can no longer get the certificate if you successfully pass the test.