
(not provided) will go 100% in 2013!
Recently (not provided) has received a real hype in world of SEO. Although it’s not like some new algorithm update that Google has rolled-out, the panic is due to the fact that (not provided)’s pace has picked up acceleration and it’s covering more percentage of total visits than ever before.
According to Not Provided Count current “(not provided)†is at just above 80% (based on 60 sites which they are gathering data from). They’re projecting that the figure will reach 100% by mid November 2013. If we talk about our own site, we have seen coverage of over 85% already.
Google started encrypting search queries way back in 2011. At the beginning, it did not cause much concern, as Google always taken gradual approach in applying their changes. However, as time went by, it became a real pain (and now it’s becoming a real frustration) to report organic traffic figures to clients – I mean, how do you claim or justify that “(not provided)†traffic was bought by your hard work on the campaign?
Companies like Fresh Egg has been developing tools, which might give you some insight based on historic data. Call me skeptical but I think the tool will only be able to provide results on an assumption basis. Also, what if you don’t have any historic data? To make it clear, I’m not hating and it’s early days for the tool so I could be wrong – total credit to them if they really can make it happen. But then what’s going to stop Google applying a small tweak to put us all back to square one?
Finding a solution
So, I searched tirelessly (and I’m sure many of you have done the same yourself) to find a way that will extract traffic figures out of “(not provided)†and give some clarity for reporting. I came across many sites which managed to get my click with misleading blog titles but hey! The methods they’ve stated were no use at all, plus all it did was to make me even more annoyed and want to give up on finding a solution.
Finally, I decided I would just follow my own old school ways that gave me far more accurate figures to report than using methods that are; 1) time consuming to setup and 2) will require fiddling with your valuable data – something I was not willing to do!
Most commonly when it comes to reporting organic traffic to clients, SEO Consultants tend to include total organic traffic and traffic that was bought by optimised keyword(s) (by filtering organic traffic using specific keyword(s)). There is nothing wrong with extracting data this way, except it becomes too specific to a certain keyword(s) and you will end up missing out on tonnes of additional keywords that you possibly can take credit for and claim their traffic to be the result of successful campaign that you’re managing. More importantly, if you were to filter traffic by specific keywords, the total traffic figure won’t include “(not provided)â€.
Traditional method of data extraction
I’m going to start by demonstrating the traditional way of differentiating organic visits that is brought by optimised keywords. Secondly, I will show you a traffic extraction method that includes “(not provided)â€.
Step 1 – Total Organic Traffic
Figure-1 below shows a view of total organic traffic with the top 10 phrases that contributed by bringing high volume of traffic. As expected, “(not provided)†is biggest number in terms of visits. From this view I will be taking the figure of 18,721 as the total amount of organic traffic received in past 30 days.
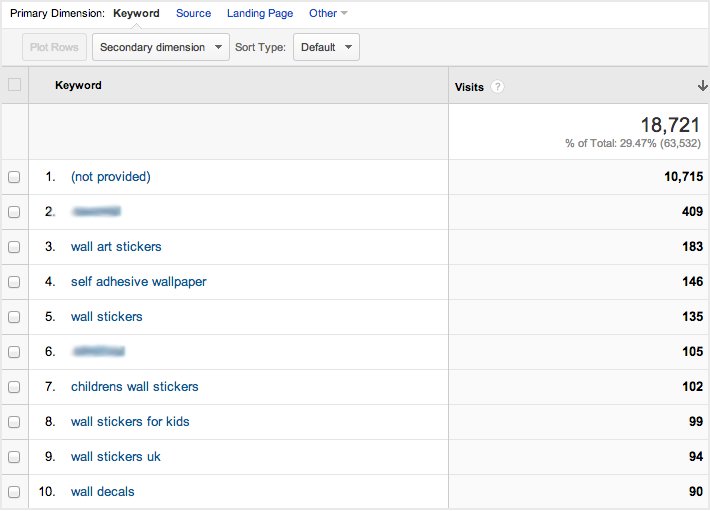
Fig. 1. View of total organic traffic – Traffic Sources > Sources > Search > Organic
Step 2 – Traffic from Optimised Keywords (Filter)
Second step will be to filter out optimised keywords from total organic traffic. To do this, I will click on “Advance†(next to search box, above “% New Visitsâ€) and then enter the keyword that I would like to filter out (with settings as: Include, Keyword, Containing).
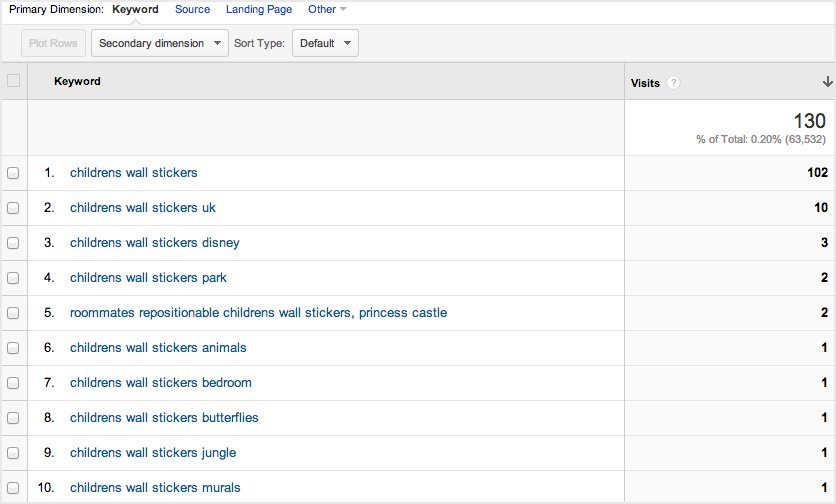
Fig. 2. Filtered result view of Childrens Wall Stickers
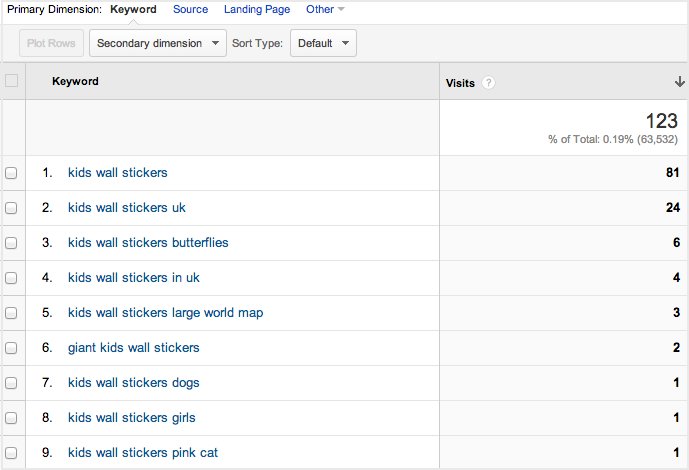
Fig. 2.1 Filtered result view of Kids Wall Stickers
Above Figure-2 and Figure-2.1 are displaying result view of applied filter, which I ran for two of the optimised keywords, “Childrens Wall Stickers†and “Kids Wall Stickersâ€. The combining figure of both filtered results is 253 organic visits. As you can already see the limitation of these results, they are only displaying searches that contain whole or part of the optimised keywords.
The alternative approach
Let’s look into extracting data via a slightly different process. In this method we are going to make use of “Secondary dimensionâ€. To start with, go back to the screen which displayed total organic traffic.
Step 1 – Use of Secondary dimension
As you can see in Figure-3 below, click on “Secondary dimension†drop-down, then drop-down “Traffic Sources†and select “Landing Page†(or if you prefer, you can type Landing Page inside the search box).
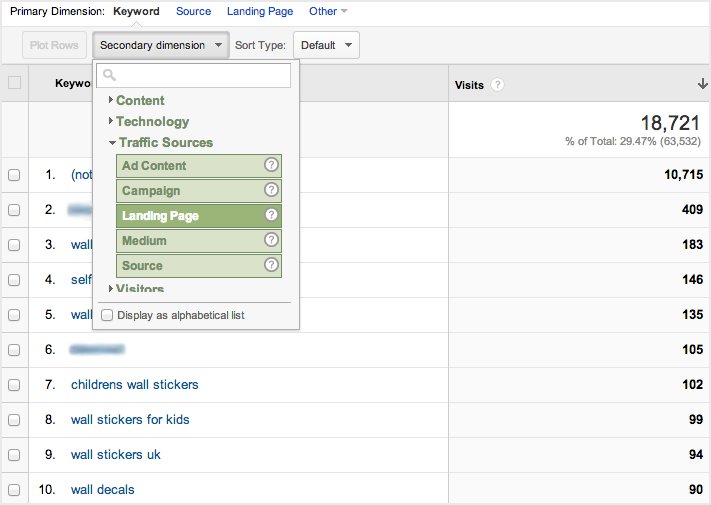
Fig. 3. Applying Landing Page in Secondary dimension.
After following the steps listed in Figure 3 above, you will see something similar to what is displayed in Figure-4 below. As you can see in Figure 4, “(not provided)†is occupying 8 out of 10 results – we can clearly agree and understand the relevance of the recent rise in fear and frustration amongst online marketers regarding the increase in “(not provided)†just by considering the following screenshot.
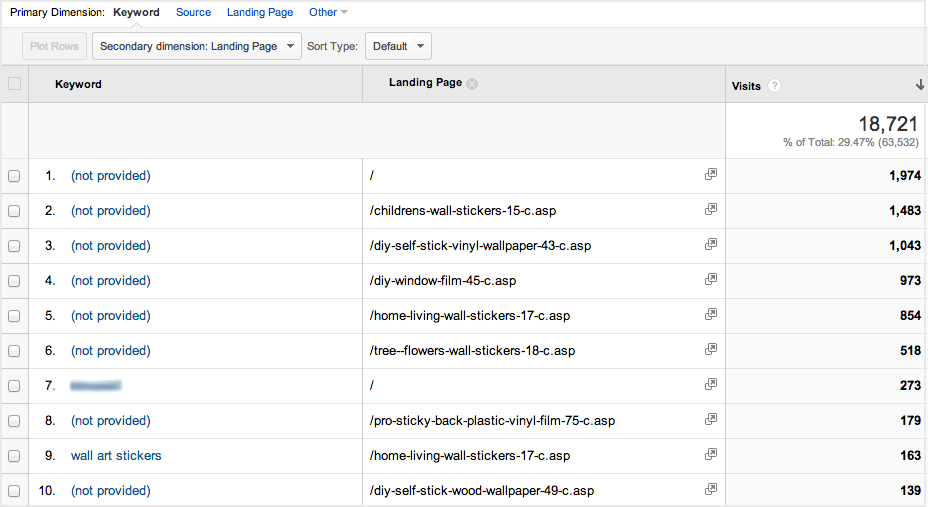
Fig. 4. Result view of Secondary dimension: Landing Page.
Step 2 – Landing Page filter in Secondary dimension
To drilldown to the number of visits we are after, firstly we will need to apply a filter on the optimised landing page (this is same concept as before when I applied a filter on a specific keyword). To do this, click on “Advance†and in the dimension box select “Landing Page†(the box will have “Keyword†selected as a default), then select “Exactly matching†(it will be “Containing†by default). Lastly, type in the optimised page’s URL (at this stage your screen should look similar to Figure-5) and click “Applyâ€.
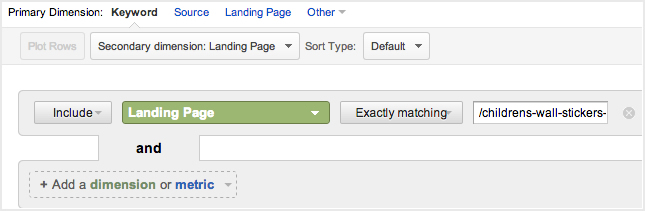
Fig. 5. Applying filter in Secondary dimension: Landing Page.
Figure-6 below is showing filtered results view of optimised page, achieved after following the steps listed above. As you can see, this result not only contains two of the optimised keywords that I ran filters on earlier but it also contains many other keywords, which I would not have included in my report to the client if I were to only include data extracted from exact keywords.
This gives a huge potential for expansion of the campaign and by applying some effort towards keywords that are already bringing visits, there is a possibility of attracting even more traffic and perhaps enquiries too.
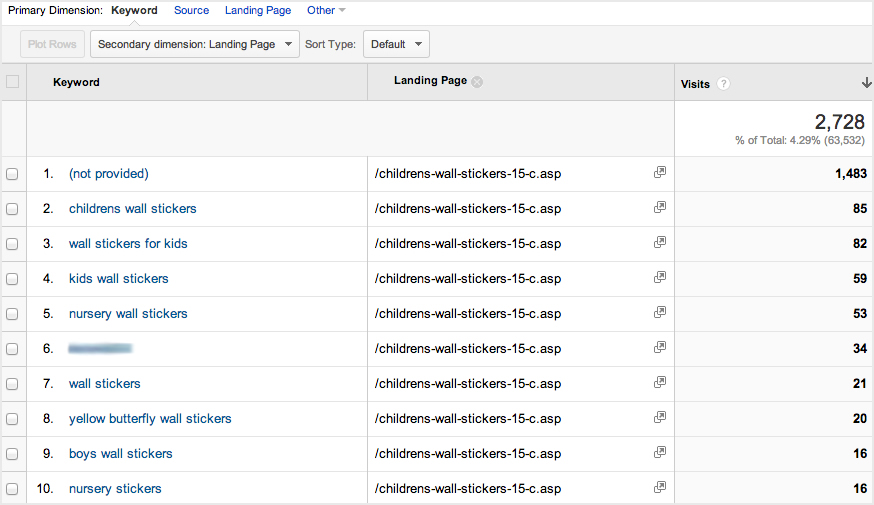
Fig. 6. Filtered result view of optimised page.
It is noticeable that even in this method of data extraction, “(not provided)†is at the top with the highest number of visits assigned to it. Nevertheless, it is fair to say that majority of the keywords that are hidden in (not provided)’s count, are likely to be what the page is optimised for. As it is highly unlikely that the company name (or any other phrases) would have bought in such a number of visits to this optimised page – so in all fairness (even if it’s an assumption) it is okay to claim this traffic to be something of your hard work.
Another advantage of this method is that it will highlight if there is a need to improve optimisation. For example, if you noticed one of the optimised pages is receiving traffic for keyword(s) that is/are optimised on another page, this can be causing internal conflict and confusing Google. In this instance, it’s worth introducing internal links to aid Google in pointing to the correct landing page. Or it may be worth keeping the optimisation on the page Google thinks is correct and de-optimise the other page (whatever is more logical).
Traditional vs Alternative method
If we make a brief comparison between the traditional and the alternative method, you’ll see that there is a significant difference:
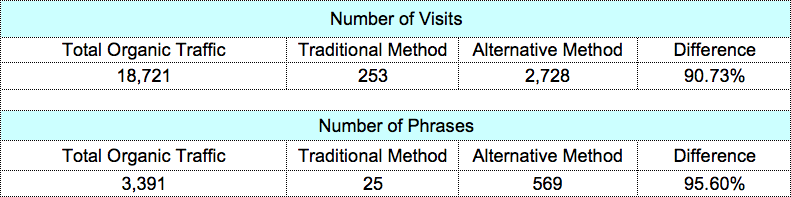
The figures above speak for themselves and they also show how much of a missed opportunity it would be if a different approach is not considered.
Use of Custom Reports
Now, to make life a little easier or to introduce some efficiency in generating reports you can take advantage of setting up custom reports. The opportunity to set up custom reports is another one of amazing features that Google Analytics provides.
I would recommend anyone to use this feature. To begin with it might seem a little time consuming but it’s worth it in the long run. If you can successfully set up all your reports at the start of the campaign, it will make your life a lot easier if you’re frequently required to report figures to client.
Properties to set for a Custom Report
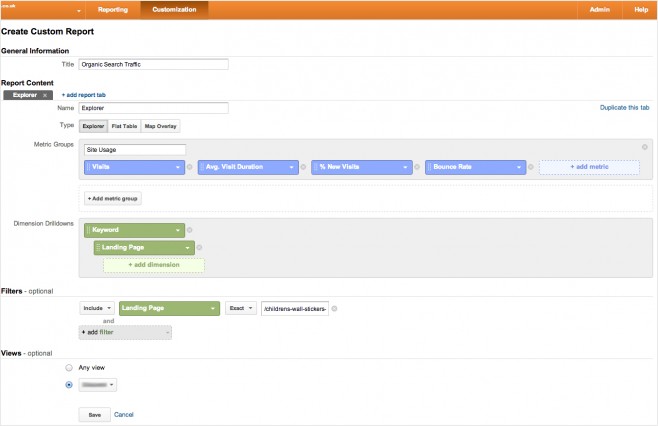
Fig. 7. View of properties that are set for creating a new custom report for a particular landing page.
What you see in Figure-7 above is in-essence what has been covered before in different steps. When the newly set up custom report is accessed, it will generate a report screen that is shown in Figure-8 – you may notice it’s exactly same as Figure-6 but without the “Landing Page†column (as the whole report is based on Landing Page).
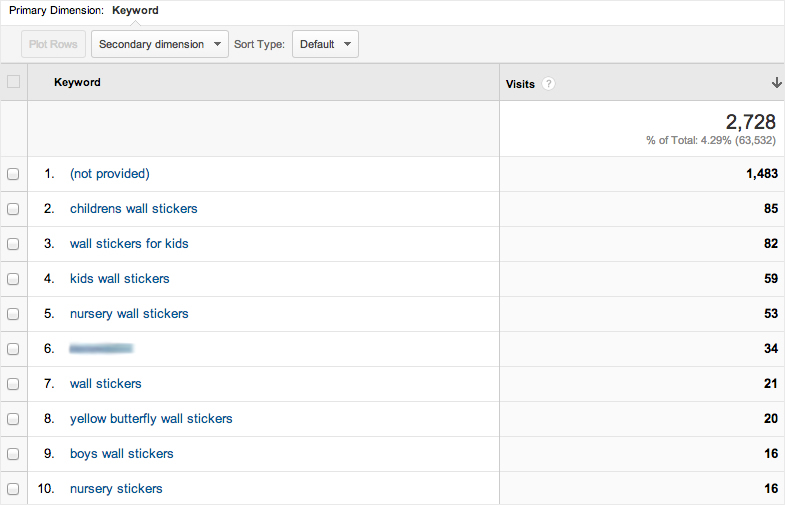
Fig. 8. View of custom report for optimised landing page.
We made Google what it is today!
It’s us SEO Consultants who have contributed tonnes of well optimised websites to the search engines rather than letting search bots do their own work in figuring out what the websites are about. We gave Google access to precious data and helped in creating a database that could be as big as Mount Everest, but in return Google is giving us “(not provided)â€.
We as humans have the tendency to want an easy life and for that we become slaves to anything that provides us quick and easy answers. Our human laziness has even reached the Internet. We like regularity and don’t really support change – I mean how many of you even consider trying searching on Bing or any other search engines when you didn’t find what you were looking for on Google? It won’t be many (actually it’ll be none). Who created the term “Google it!� We did!
Okay my rant is over and in Google’s defence, they never told us to use their services nor told us to optimise websites so Google can get bigger (though they do suggest doing this in their Webmaster Tools site). Also, morally this will seem a good move to any Internet user as Google claim to be making this move to provide more privacy to their users – but if that’s the case then why provide data to those who will pay for PPC? And my suggestion to those who care about their privacy is to use search engines such as DuckDuckGo (they don’t play games like Google).
This is what happens when you give all the importance and attention to one website – yes one website, that’s what Google once was! Hence the saying, don’t put all your eggs in one basket.
Don’t panic – Organic SEO is not dead (well, not yet anyway!)
The example I have covered in this post might not be suitable for campaign(s) you’re managing but I hope this has helped you to get an inspiration on trying different approaches and/or be curious on how you can find alternative ways to fight the baddy “(not provided)â€.
As much as we would all like to protest against Google’s decision of eventually going 100% “(not provided)†purely to boost their PPC revenue and to make our life that extra difficult, I would say if you’re a logical thinker or an analytical person – where there is a will, there is always a way! 🙂