
Successful conversion rate optimisation (CRO) requires analysis, testing and patience to get the most successful results.
Why Test?
Our aim is always to maximise the number of visitors who engage with the content on any given website, allowing them to ultimately discover a product or service which they feel will benefit them as a business or individual. However, working out the best way to engage visitors based on a specific brand, product or service is not an exact science.
The motivation and behaviour of each person landing on a website will differ significantly from one website to the next. Therefore, understanding this behaviour at a more detailed level can only improve our ability to employ the most successful user journey and calls to action on each website. This then enables us to streamline the path to conversion through improved user experience (UX) and engagement.
Deciding What to Test
To take advantage of existing and future visitor traffic, we generally first analyse a website from a CRO perspective to understand which elements of the design or development, based on our experience, can be fine-tuned to improve click-through rates for given actions. Within this initial report we recommend general improvements to aspects of the site design, UX and content strategy which are valid for your A/B testing strategy to help support the achievement of the primary aims and objectives of the website in question; whether this is to generate more enquiries, sign-ups or online sales for example.
As part of this process there are a number of tools and services available to help implement, track and compare the results of A/B tests. Here at Creare one of the tools we like to use for our clients as well as our own A/B and multivariate testing is Optimizely.
How to Test with Optimizely
It’s quick and easy to get your first experiment up and running with Optimizely. Simply sign up for an account (currently they offer 30 days free), enter the URL of the page you wish to test and then copy and paste the unique ‘snippet’ of javascript they provide into the <head> section of your website code.

Then to build your first experiment, simply load the page in question within the Optimizely editor and create the variations of the page you wish to test within their visual editor. Even if you have no coding experience, you can fairly easily manipulate the page to make changes to content, layout and styling. You can also define which version of your website you wish to test within Options > Editor Settings for Desktop, Tablet or Mobile.
Although you could in theory significantly change the whole page using the editor, we generally recommend to make only small changes within each experiment initially so that you can track results on the impact of a specific element change, rather than adding too many confounding variables which may make your results more difficult to analyse.
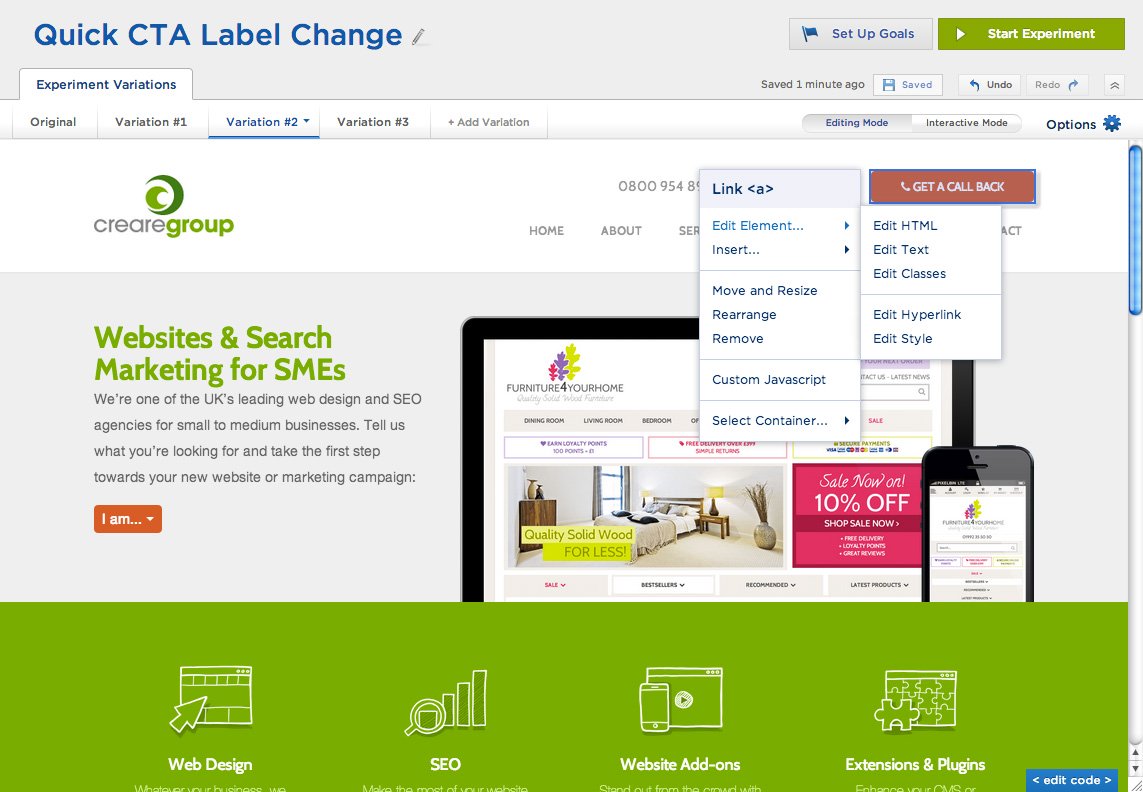
Once you have created your variations, you can then decide which elements of the page or particular interaction with the website you wish to track within Options > Element Tracking. You can measure general engagement (interaction with any aspect of the page) for example as well as specific clicks and behaviours such as the submission of a form or the click of a certain button, right through to custom goals based on more complex user behaviour. You can also link your Optimizely experiments with other tools you may already be using to track analytics on your website such as Google Analytics, KISSmetrics and ClickTale within the Options menu. If you choose to also integrate other analytics tracking on the experiments you run as well as the in-built Optimizely ‘results’ then you will ensure you have the most accurate and full data to analyse.
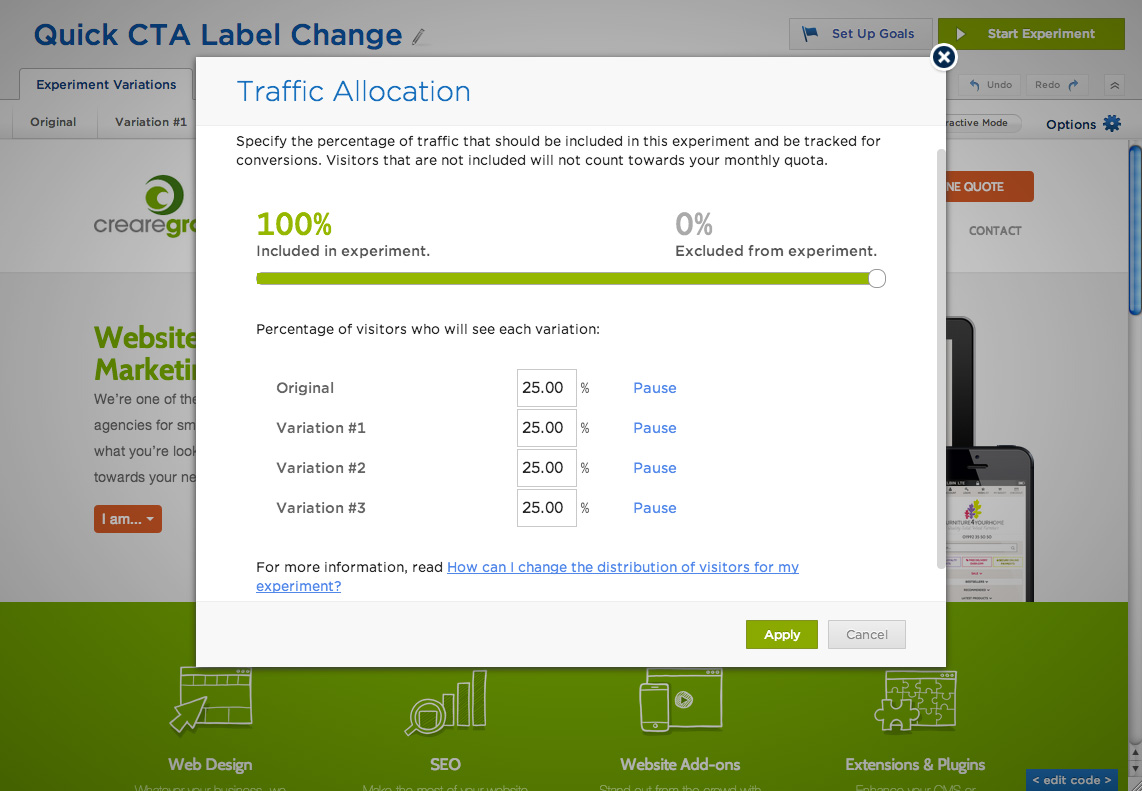
The final part of preparing your A/B or multivariate test for launch is to decide how much and which types of traffic you wish to funnel through to each of your variations within Options > Traffic Allocation. Depending on your account type, Optimizely also allows you to specify traffic segments to include or exclude from your tests so that you can create experiments with custom visitor targeting relevant to your experiment goals.
When you’re ready and prepared to track your results, you can then click Start Experiment!
Tracking & Analysing Results
Whilst your experiment is running you will be able to see real-time visits and conversion results based on the goals which you have configured for your test. The live results will show you the performance of each of the variations of your page along with confirming, once you have reached statistical significance, if there is an improvement in conversion for any given variation.
The test example shown below was based on 3 different variations of language used on a call to action button within the header of our own website encouraging customers to click to get in touch with us.
Variation #1 Get a Free Quote
Variation #2 Get a Call Back
Variation #3 Quick Online Quote
Original Request Call Back
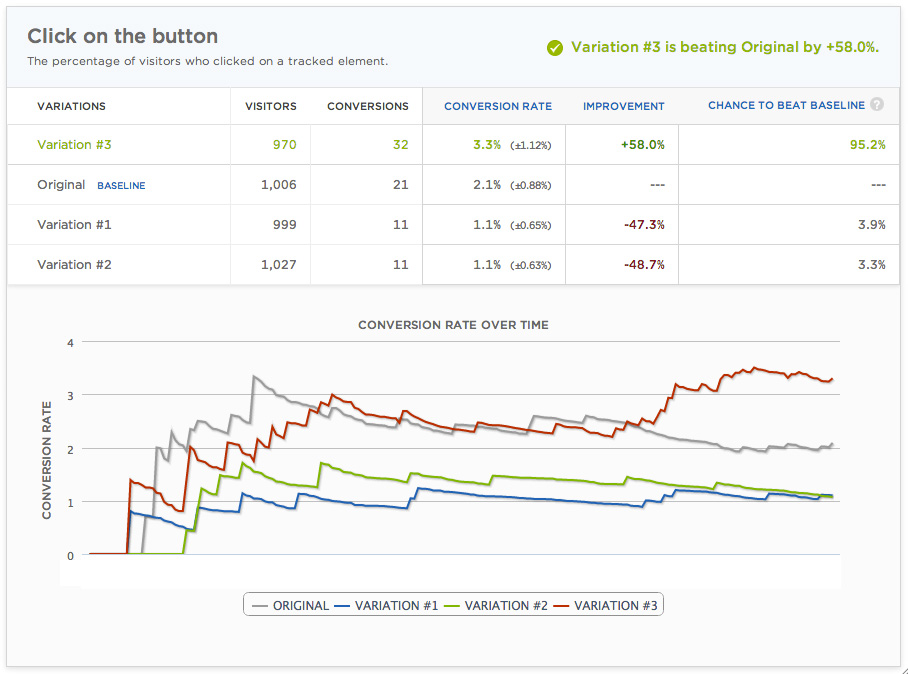
You can see that overall our visitors engaged most with button Variation #3 (Quick Online Quote) which resulted in a +58% improvement in conversion for us when compared to the original. The results also showed that the 2 other button variations we tested actually reduced the conversion rate by nearly 50% when compared against the original. It was therefore fairly easy to decide which variation was the winner in this particular experiment!

Analysing and comparing the results of your CRO testing with existing analytics data should help you to better understand the behaviour of your site visitors. This will then enable you to further improve the user journey on your website and ultimately your aim to increase the number of conversions being achieved by implementing each of your ‘winning’ variations over time.
Do you have any other tools or tips you’d like to share from your own A/B or multivariate testing?